GW150914 Example
Let’s have a quick look at what Gravpy can do. In this example we’ll have a look at the sensitivities of some of the current and historical interferometers, and then have a look at how GW150914, the first detected gravitational wave event would have looked in the detectors.
Let’s get started by importing astropy’s units module, and numpy, which we’ll need:
import astropy.units as u
import numpy as np
Simulating an interferometer
A number of approaches to detecting gravitational waves have been discussed in the literature, and have been constructed, ranging from pulsar timing arrays to Weber bars. We’re going to simulate some interferometers, like the LIGO detectors which made the detection of GW150914. To do this, gravpy has a package for interferometers, with some “pre-made” interferometers.
import gravpy.interferometers as ifo
We can now simulate some interferometers. Let’s start with Advanced LIGO.
aligo = ifo.AdvancedLIGO()
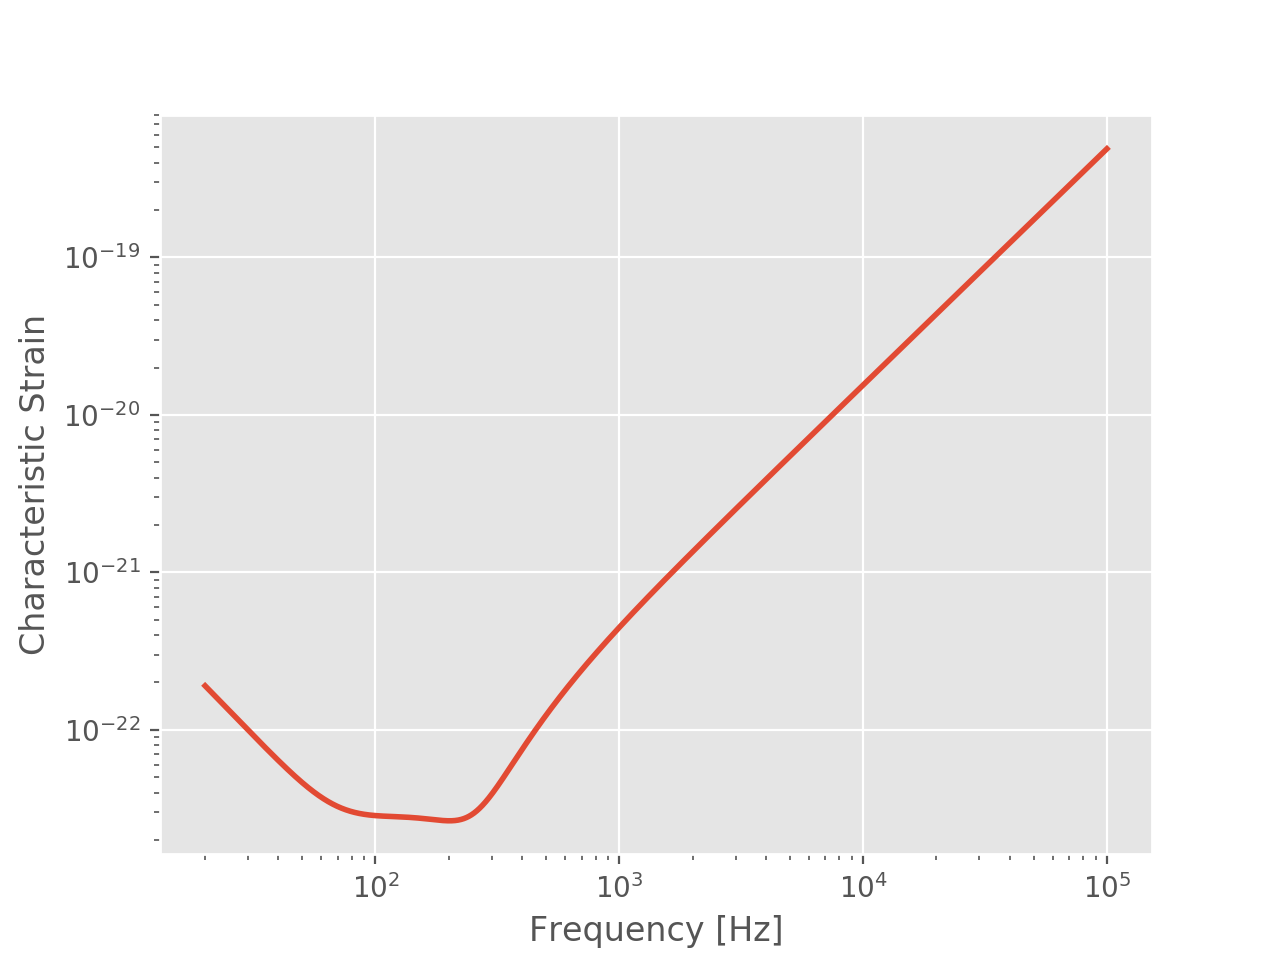
We can take a look at the sensitivity curve using the ~aligo.plot() method:
(Source code, png, hires.png, pdf)
Simulating an event
Now that we have an interferometer, let’s have a look at an event. We’ll simulate a compact binary merger, or a “CBC”.
The first observed gravitational wave event was a CBC, a binary black hole merger. We can simulate that event using gravpy.
import gravpy.sources as sources
cbc = sources.CBC(frequencies=np.logspace(-4, 5, 1000) * u.hertz,
                  m1=32*u.solMass, m2=30*u.solMass, r=0.8*1e9*u.parsec)
Let’s have a look at the frequency behaviour of the event:
Now that we have a detector and an event we can find out the SNR of the signal in the detector.:
print cbc.snr(o1_aligo)
   112.363423673
That’s quite a bit higher than the SNR of the observed event, so what gives? We simulated the design sensitivity of the aLIGO detectors, but the event was discovered in the first observing run, which was well below design sensitivity. We can fix this by simulating the detector with its “O1” configuration.
o1_aligo = ifo.AdvancedLIGO(configuration='O1')
Let’s have a look at this and the event on a plot.
import matplotlib.pyplot as plt
import gravpy.interferometers as ifo
import gravpy.sources as sources
import astropy.units as u
o1_aligo = ifo.AdvancedLIGO(configuration='O1')
cbc = sources.CBC(frequencies=np.logspace(-4, 5, 1000) * u.hertz,
                   m1=32*u.solMass, m2=30*u.solMass, r=0.8*1e9*u.parsec)

plt.style.use('ggplot')
f, ax = plt.subplots(1)
o1_aligo.plot(ax)
cbc.plot(ax)
The SNR looks better now:
>>> print cbc.snr(o1_aligo)
24.8134701645
How about other interferometers?
>>> geo = ifo.GEO()
>>> iligo = ifo.InitialLIGO()
>>> tama = ifo.TAMA()
>>> virgo = ifo.VIRGO()
>>> aligo = ifo.AdvancedLIGO()
>>> o1_aligo = ifo.AdvancedLIGO(configuration='O1')
>>> elisa = ifo.EvolvedLISA()
>>> print "{} \t\t {}".format('IFO', 'SNR')
>>> print "------------------------------"
>>> for inter in [aligo, o1_aligo, elisa, iligo, virgo, geo, tama]:
...    print "{} \t\t {}".format(inter.name, cbc.snr(inter))
IFO              SNR
------------------------------
aLIGO            112.363423673
aLIGO [O1]       24.8134701645
eLISA            109.12468906
Initial LIGO     6.37979047218
VIRGO            7.86000380341
GEO600           4.80002280092
TAMA             0.258152593608
So we can see that this event wouldn’t have exceeded an SNR of 8 in any of the previous generation of detectors, but would have been loud in eLISA.